
Understanding Candlestick Charts
Learn how to read and interpret candlestick charts, a crucial tool for analyzing price movements in cryptocurrency trading.
Candlestick charts are a powerful tool for analyzing price movements in financial markets, including cryptocurrency trading. Originally developed in Japan over a century ago, these charts offer a visual representation of price action, which can help traders make informed decisions.
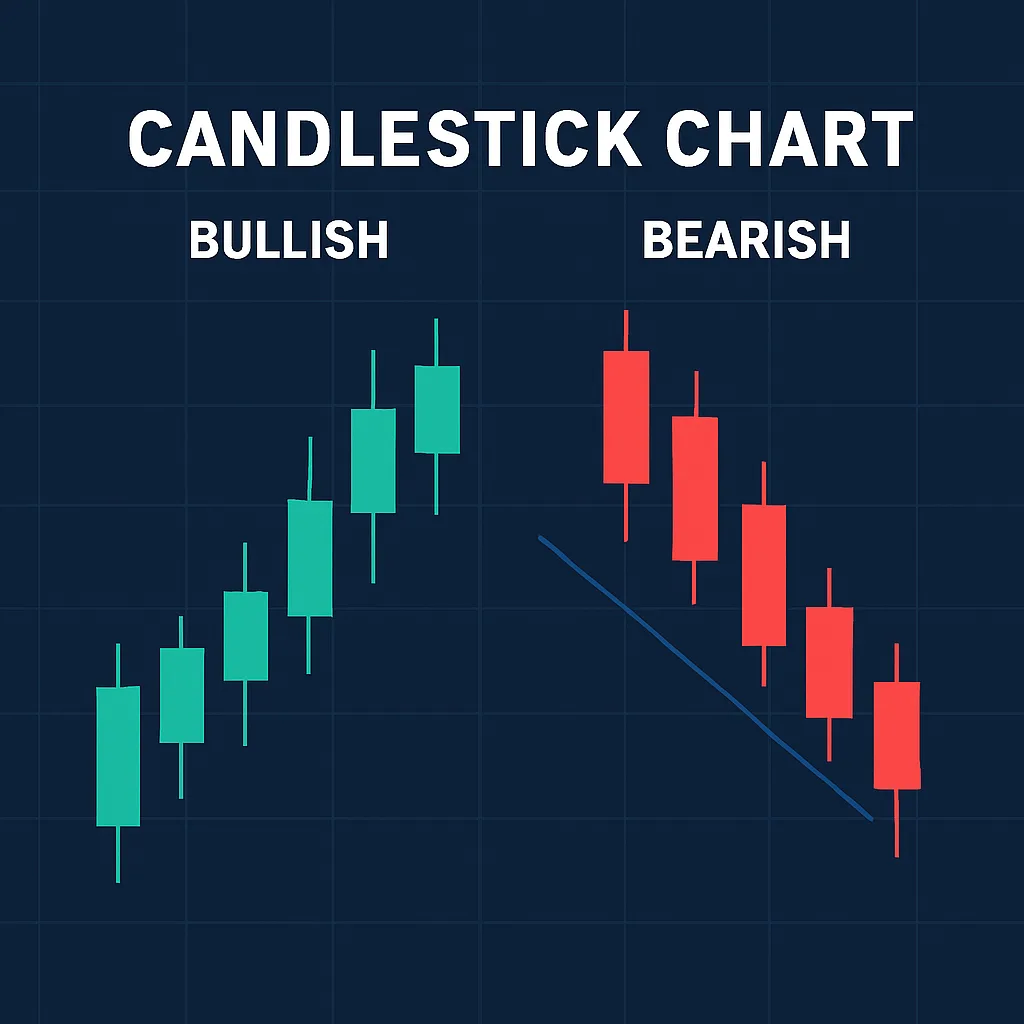
A single candlestick represents a specific time period, such as a minute, hour, day, or week, and shows four key pieces of information about that period: the opening price, the closing price, the highest price, and the lowest price. This is visually represented by the candlestick's body and wicks.
The Anatomy of a Candlestick
The body of the candlestick is the thick part, which illustrates the open and close prices of the trading period. If the closing price is higher than the opening price, the candlestick is often colored green (or white) and called a 'bullish candle.' Conversely, if the closing price is lower, it is colored red (or black) and termed a 'bearish candle.'
The thin lines above and below the body are known as wicks or shadows. The top wick represents the highest price during the period, while the bottom wick represents the lowest price.
Interpreting Candlestick Patterns
Traders look for patterns in candlestick charts to predict future price movements. Some common patterns include:
- Doji: Indicates indecision in the market, where the opening and closing prices are very close.
- Hammer: A bullish reversal pattern often found at the bottom of a downtrend, characterized by a small body and long lower wick.
- Shooting Star: A bearish reversal pattern often seen at the top of an uptrend, with a small body and long upper wick.
Understanding these patterns and what they signify can give traders an edge in anticipating market trends.
Practical Tips for Using Candlestick Charts
When using candlestick charts, it's essential to consider the context and not rely on them in isolation. Combine candlestick analysis with other technical indicators like moving averages and RSI to confirm trends and make more accurate predictions.
Regular practice and analysis will enhance your ability to read these charts and develop effective trading strategies.