
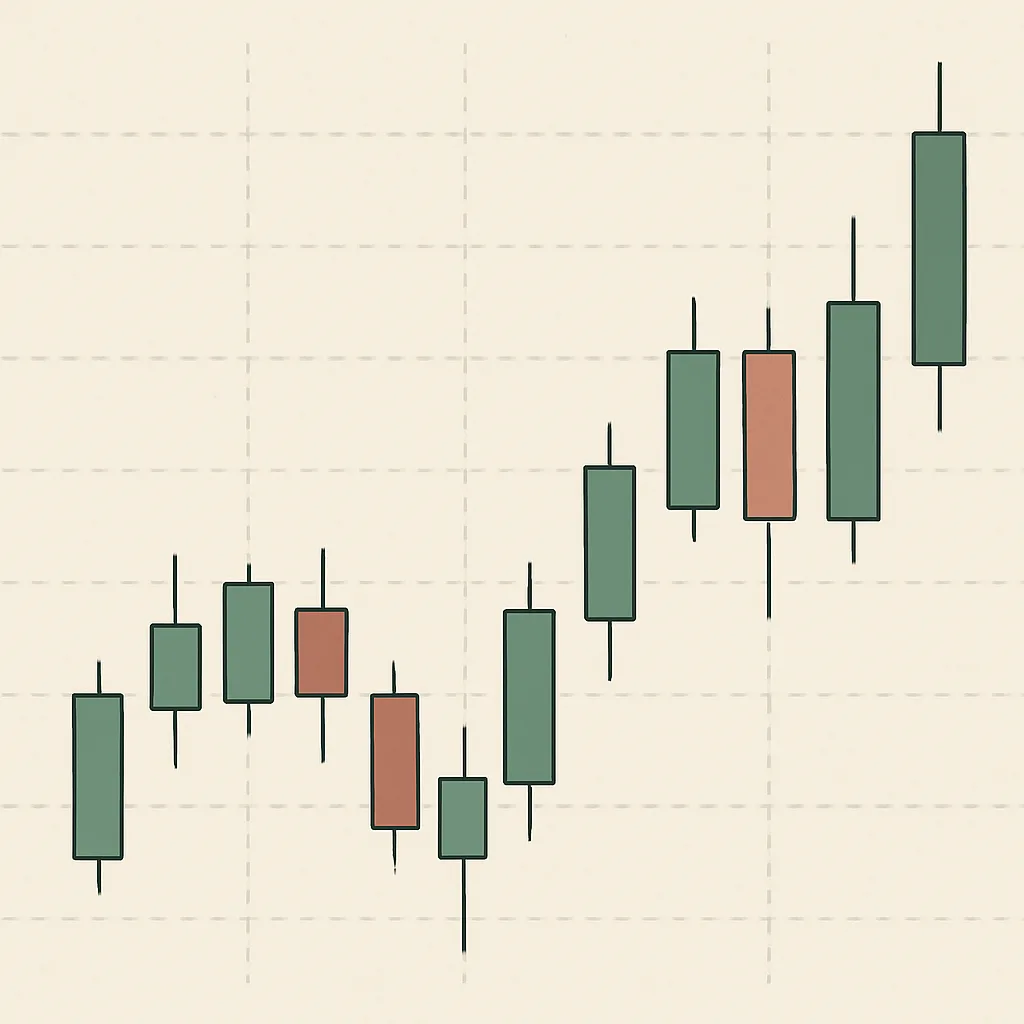
How to Read Candlestick Patterns on 1-Hour and 4-Hour Charts
Learn how candle anatomy, chart timeframe, and nearby price levels work together to make 1-hour and 4-hour candlestick patterns more useful.
Candlestick charts summarize price movement over a chosen period. On a 1-hour chart, each candle represents one hour; on a 4-hour chart, each represents four hours. Reading patterns on either timeframe starts with the same basics, but the timeframe changes how much market activity each candle contains.
Read the parts of a candle
Each candle shows four prices: open, high, low, and close. The candle body spans the open and close. Its wicks, also called shadows, show the highest and lowest prices reached during the period. A candle that closes above its open is commonly shown as bullish, while one that closes below its open is commonly shown as bearish. Colors vary by chart settings, so check the chart’s legend.
A long body indicates a larger difference between the open and close. A long wick indicates that price moved beyond the body before returning. Neither feature predicts what happens next by itself: a wick can reflect a brief rejection, volatility, or ordinary trading noise.
Recognize common patterns in context
- Doji: The open and close are close together, leaving a small body. It can show indecision, but it is not automatically a reversal signal.
- Hammer-like candle: A small body near the top of the candle with a longer lower wick. After a decline, it may suggest that buyers pushed price back up, but confirmation matters.
- Shooting-star-like candle: A small body near the bottom with a longer upper wick. After a rise, it may suggest that higher prices were rejected; it does not guarantee a drop.
- Bullish or bearish engulfing: The body of a candle covers the previous candle’s body. Traders often look for these patterns near a meaningful level and after a clear directional move.
Pattern names describe candle shapes, not certain outcomes. The surrounding trend, nearby support or resistance, trading volume, and the next candle can all affect how a setup is interpreted.
Compare the 1-hour and 4-hour views
The 1-hour chart provides more detail and more frequent signals. It can help you examine short-term price action, but it is also more vulnerable to market noise. The 4-hour chart combines more trading activity into each candle. Its patterns may take longer to form and can provide broader context, though they still do not remove uncertainty.
Use the charts together rather than treating one as universally better. For example, you might use the 4-hour chart to identify the broader direction and important price areas, then use the 1-hour chart to inspect a potential setup. If the timeframes disagree, treat that as a reason to be cautious rather than forcing a trade.
A practical reading routine
- Check the timeframe and candle status. An unfinished candle can change shape before it closes. Avoid treating its current appearance as a confirmed pattern.
- Look at the broader structure. Note whether price has been making higher highs and higher lows, lower highs and lower lows, or moving sideways.
- Mark nearby price areas. Previous turning points can provide context, but support and resistance are zones, not exact guarantees.
- Describe the candle plainly. Identify body size, wick length, and closing position before assigning a pattern name.
- Wait for context or confirmation. A later close, a reaction at a relevant level, or other evidence may strengthen or weaken an interpretation. Confirmation can also mean entering later, so it does not eliminate risk.
- Plan risk before acting. Decide in advance how much you can afford to lose. Candlestick patterns are not reliable enough to justify risking money you cannot afford to lose.
Common mistakes to avoid
Do not assume every named pattern has the same meaning in every market. Do not compare candles without checking their timeframe, and do not make a decision from a single candle while ignoring the preceding move. Also remember that crypto trades continuously: a 4-hour candle’s start and end depend on the exchange’s chart settings and time zone.
Candlesticks are a way to organize price information, not a complete trading strategy. Practice identifying patterns on historical charts, note what happened afterward without cherry-picking examples, and consider using paper trading before risking real funds. This lesson is educational, not financial advice.