
How to Read Order Book Depth for Potential Support and Resistance
Learn how visible bids and asks can highlight potential price barriers, and why order-book levels should be treated as clues rather than guarantees.
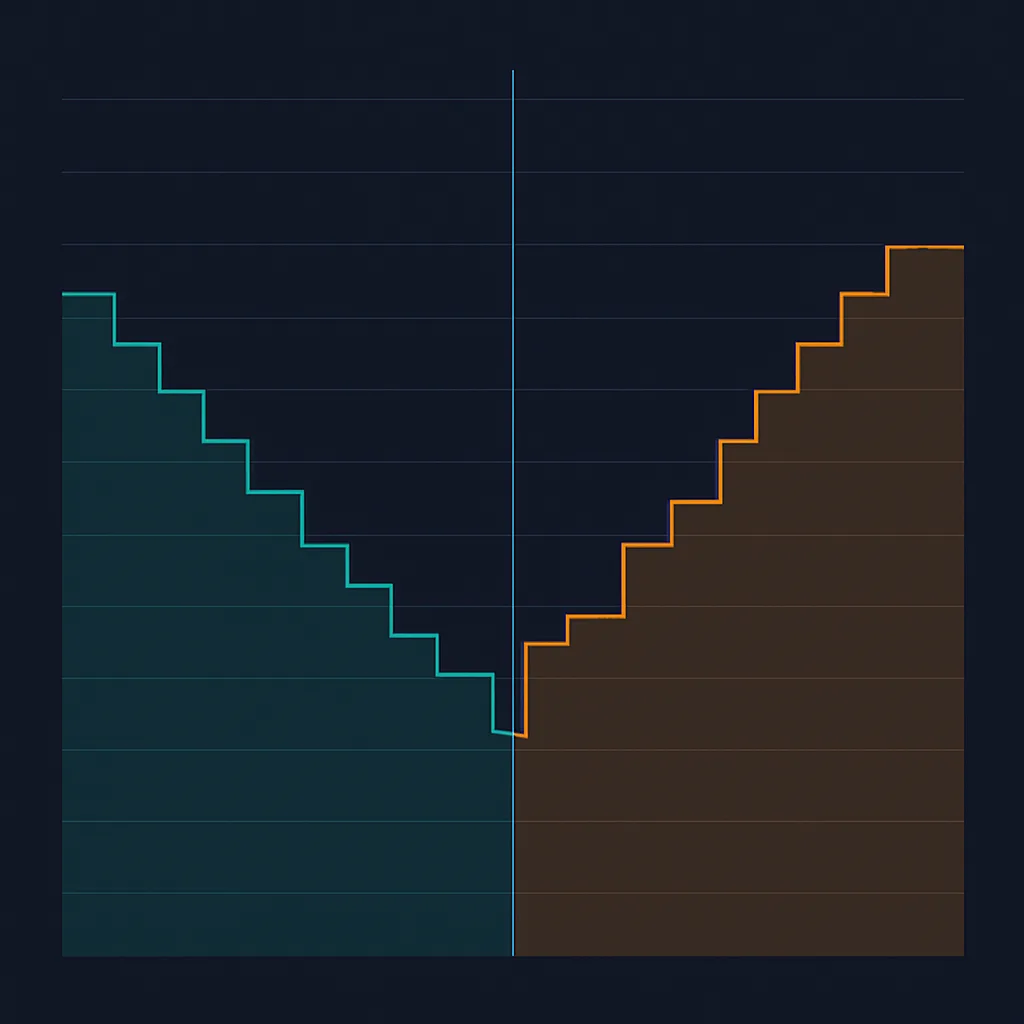
An order book shows resting buy and sell limit orders at different prices. Traders often inspect it for clusters of bids that may act as potential support and clusters of asks that may act as potential resistance. These levels can offer useful context, but they do not predict where price must turn.
What the order book displays
The bid side lists buy orders below or near the current market price; the ask side lists sell orders above or near it. Each price level may show the quantity available there. The difference between the best bid and best ask is the spread, while the combined quantities across multiple levels form visible market depth.
Spotting possible support and resistance
A comparatively large group of bids can suggest an area where buyers may be willing to absorb selling. Traders may watch that zone as potential support. A concentration of asks can indicate an area where sellers may meet incoming demand, making it potential resistance. Look for clusters across nearby prices rather than assuming one exact price is decisive.
Compare the displayed size with nearby levels and with typical trading activity. A large-looking order may be insignificant for a highly liquid market, while a smaller cluster may matter more in a thin market. Also check whether price has reacted to the zone before and whether trading volume confirms activity there.
Read changes, not just a snapshot
The order book changes continuously. Orders can be added, reduced, canceled, or filled, so a screenshot captures only one moment. Watch whether a cluster remains as price approaches, whether it shifts, and whether trades actually execute near it. A level that repeatedly holds under real buying or selling pressure may be more informative than a large order that disappears before contact.
Important limitations
- Visible orders can be canceled: displayed liquidity is not a promise that it will remain available.
- Some liquidity may be hidden: the visible book may not show all potential buying or selling interest.
- One venue is not the whole market: other exchanges and trading pairs may have different liquidity.
- Large orders can mislead: apparent walls may be placed or removed to influence perception, and size alone does not prove intent.
- Price can pass through a level: support and resistance are zones of possible reaction, not guaranteed barriers.
A practical way to use the book
- Identify nearby bid and ask clusters and note the prices they cover.
- Check how deep the market is and compare order sizes with recent traded volume.
- Observe whether liquidity stays in place as price approaches and whether trades execute around it.
- Cross-check with the price chart, volume, and conditions on other relevant markets.
- Plan for the possibility that the level fails; use a broader risk plan rather than relying on the order book alone.
Order-book depth is most useful as short-term market context. It can help you locate areas where buying or selling pressure might gather, but it cannot reveal every participant’s intentions or guarantee a price reaction. Treat visible support and resistance as hypotheses to monitor, not as certainty or standalone trading signals.