
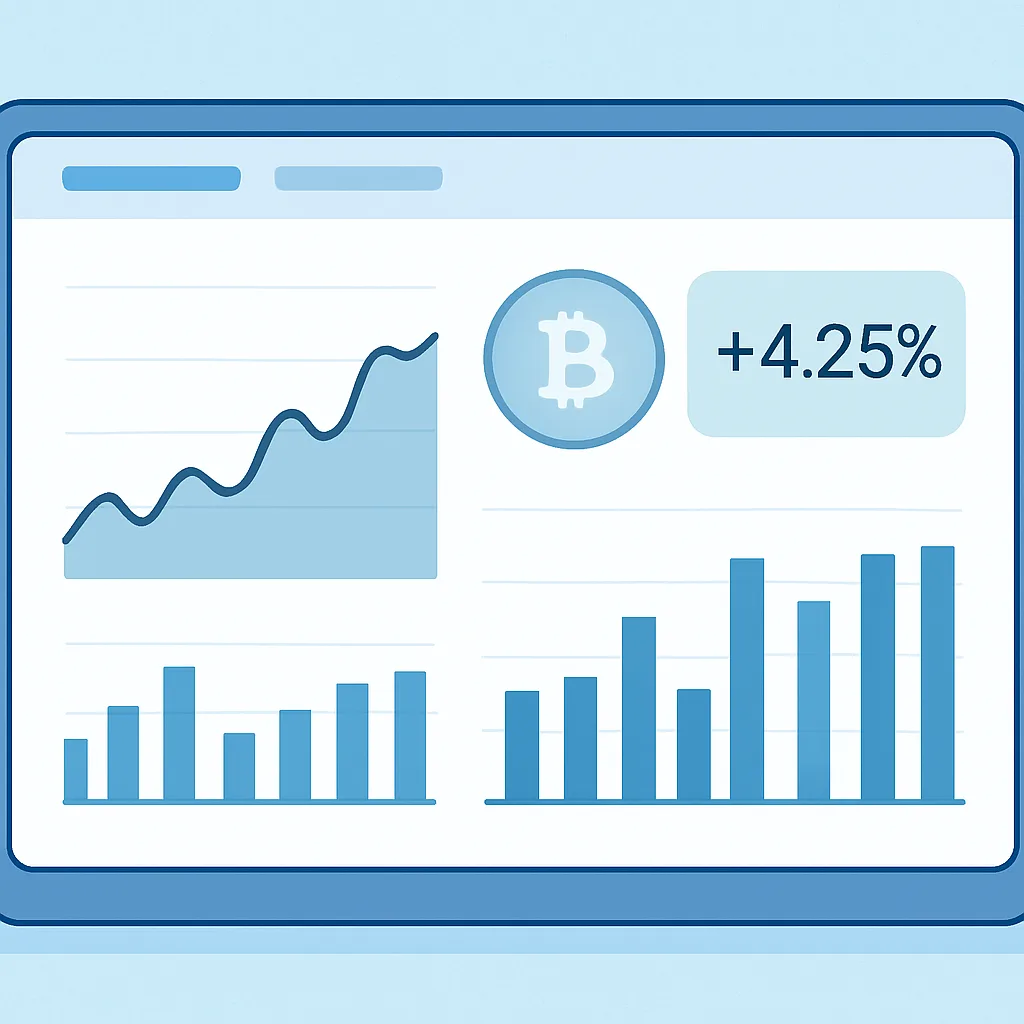
Reading Market Volume and Daily Price Movement Signals
Learn what 24-hour volume and price change show, how to compare them, and why neither metric predicts what comes next.
A crypto markets screen compresses a lot of activity into a few figures. Two common metrics are 24-hour volume and 24-hour change. Together they offer a quick snapshot of trading activity and recent price movement—but they do not tell you whether a market is safe, what caused a move, or where the price will go next.
What 24-hour volume measures
Volume represents the amount of an asset traded during a defined period. On a markets screen, “24h volume” usually refers to trading over the previous 24 hours. Depending on the platform, it may be shown in the asset itself, in a quote currency such as USDT, or as an estimated value converted to another currency.
Check the unit and market scope before comparing figures. A volume total may combine several trading pairs, or it may apply only to the pair shown. For example, BTC/USDT volume is not necessarily the same as total BTC trading volume across all markets.
Higher volume means more trading took place during the period; it does not automatically mean that an asset is more valuable or that every trade can be executed at a favorable price. Volume can also be concentrated in a small number of venues or pairs.
What 24-hour change means
The 24-hour change shows how much an asset’s price has risen or fallen relative to a reference price from about 24 hours earlier. It is commonly displayed as a percentage. A positive percentage indicates an increase over that comparison window, while a negative percentage indicates a decrease.
Platforms may calculate the window differently—for example, as a rolling 24 hours or by comparing with a fixed daily close. Always check the screen’s labels or help information if precise timing matters. The figure is a backward-looking comparison, not a forecast.
Read the metrics together
Volume can add context to a price move. A rising price accompanied by higher volume may indicate more trading activity during the advance. A sharp price change on relatively low volume may warrant extra caution, since fewer trades may be supporting the move. These are observations, not reliable signals on their own: volume can rise during buying or selling, and a high-volume move can reverse.
Consider a hypothetical token showing a 7% gain and unusually high 24-hour volume. The screen tells you the price is higher than its comparison point and that trading activity was elevated. It does not tell you whether the move was driven by new information, a temporary burst of speculation, or activity on a limited set of markets. Further research is needed.
Compare carefully
- Check the asset and pair: Make sure you are comparing the same token and trading pair.
- Check the units: Confirm whether volume is displayed in tokens, USDT, or another currency.
- Use consistent time windows: A 24-hour metric cannot be directly compared with a weekly figure.
- Look beyond the headline number: Review the chart, market depth, and relevant news for additional context.
- Be cautious with unfamiliar assets: Reported volume may not reflect easy execution or broad market participation.
Common mistakes to avoid
Do not assume that a positive 24-hour change means an asset is in a lasting uptrend, or that high volume guarantees liquidity at every price. A displayed total does not show the spread, available order-book depth, or the price impact of your own order. Likewise, a large percentage move may look dramatic partly because the asset’s price was very low or the market is thin.
Use volume and 24-hour change as screening information, then verify details before acting. Neither metric guarantees a future outcome, and this lesson is educational—not financial advice. In fast-moving crypto markets, prices and reported activity can change quickly.