
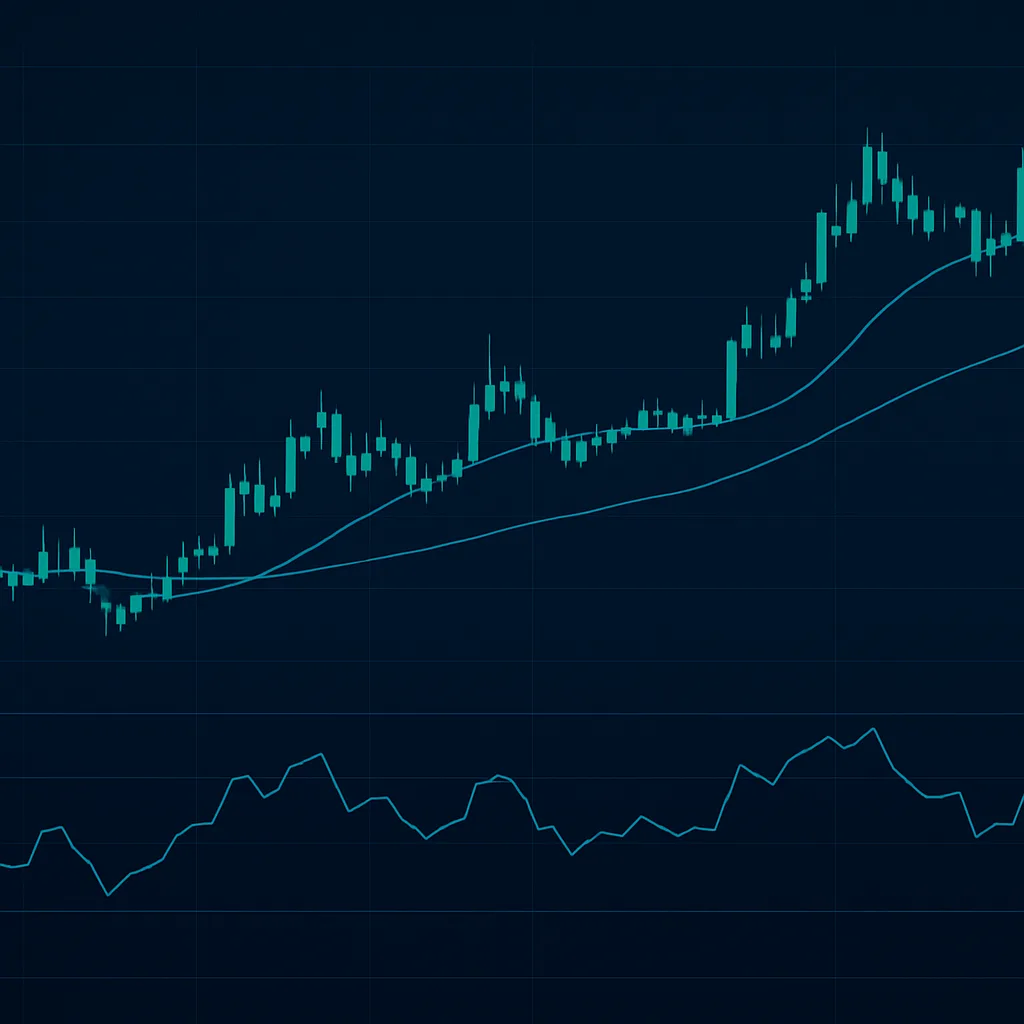
RSI and Moving Averages: Read Momentum and Trend Signals
Learn what RSI and moving averages measure, how traders interpret them, and why neither indicator predicts price with certainty.
Chart indicators turn past price data into visual summaries. The Relative Strength Index (RSI) and moving averages are two widely used tools: RSI helps describe recent momentum, while moving averages smooth price data to make trends easier to observe. They can support analysis, but they do not predict what a market will do next.
What is RSI?
RSI is a momentum indicator that compares the size of recent price gains with recent losses over a chosen period. Its value ranges from 0 to 100. Many charting tools use a 14-period setting by default, though traders may choose other settings. A shorter period tends to react more quickly and may produce more fluctuations.
Traditional RSI references include 70 and 30. A reading above 70 is often described as overbought, and a reading below 30 as oversold. These labels do not guarantee a reversal. In a strong uptrend, RSI can remain elevated; in a strong downtrend, it can stay low. RSI can also move within less extreme ranges, depending on the asset and market conditions.
What is a moving average?
A moving average calculates an average price across a selected number of past candles and updates as each new candle forms. A simple moving average (SMA) gives each price in the period equal weight. An exponential moving average (EMA) gives more weight to recent prices, so it usually responds faster to changes.
The period describes how many candles are included, not a fixed number of days. For example, a 20-period moving average on a one-hour chart uses 20 hourly candles. A shorter average follows price more closely; a longer one is smoother but responds more slowly.
How traders read moving averages
Traders may use a moving average to see the broad direction of recent prices or compare price with its average. Price above a rising average can be consistent with upward momentum, while price below a falling average can be consistent with downward momentum. Neither relationship confirms that a trend will continue.
Some traders compare two averages. A shorter average crossing above a longer one is sometimes called a bullish crossover; crossing below is sometimes called a bearish crossover. Crossovers rely on past prices and can arrive late. In sideways markets, averages may cross repeatedly and produce misleading signals.
Using RSI and moving averages together
The indicators describe different things, so they can provide complementary context. For example, a trader might use a longer moving average to assess the broader trend and RSI to check whether recent momentum is strengthening or weakening. An RSI reading near 70 does not, on its own, mean a short position is appropriate; likewise, an RSI near 30 is not an automatic buy signal.
Before relying on an indicator, check the chart timeframe, the indicator settings, and the broader market context. Indicators based on the same price history can also agree for the wrong reasons, so combining them does not remove uncertainty. Consider testing a method on historical data or in a paper-trading environment before risking funds.
Common limitations
- Lag: Moving averages and many RSI signals use historical data, so they may respond after price has already moved.
- False signals: A brief move or a choppy market can create a signal that does not lead to a lasting trend.
- Setting sensitivity: Different periods and chart timeframes can produce different readings.
- No risk protection: An indicator does not cap losses or ensure an entry or exit price.
RSI and moving averages are best treated as descriptive tools, not standalone trading instructions. Make decisions within a broader plan that accounts for volatility, position size, and the possibility of loss. Crypto prices can move sharply, and no indicator can eliminate that risk.