
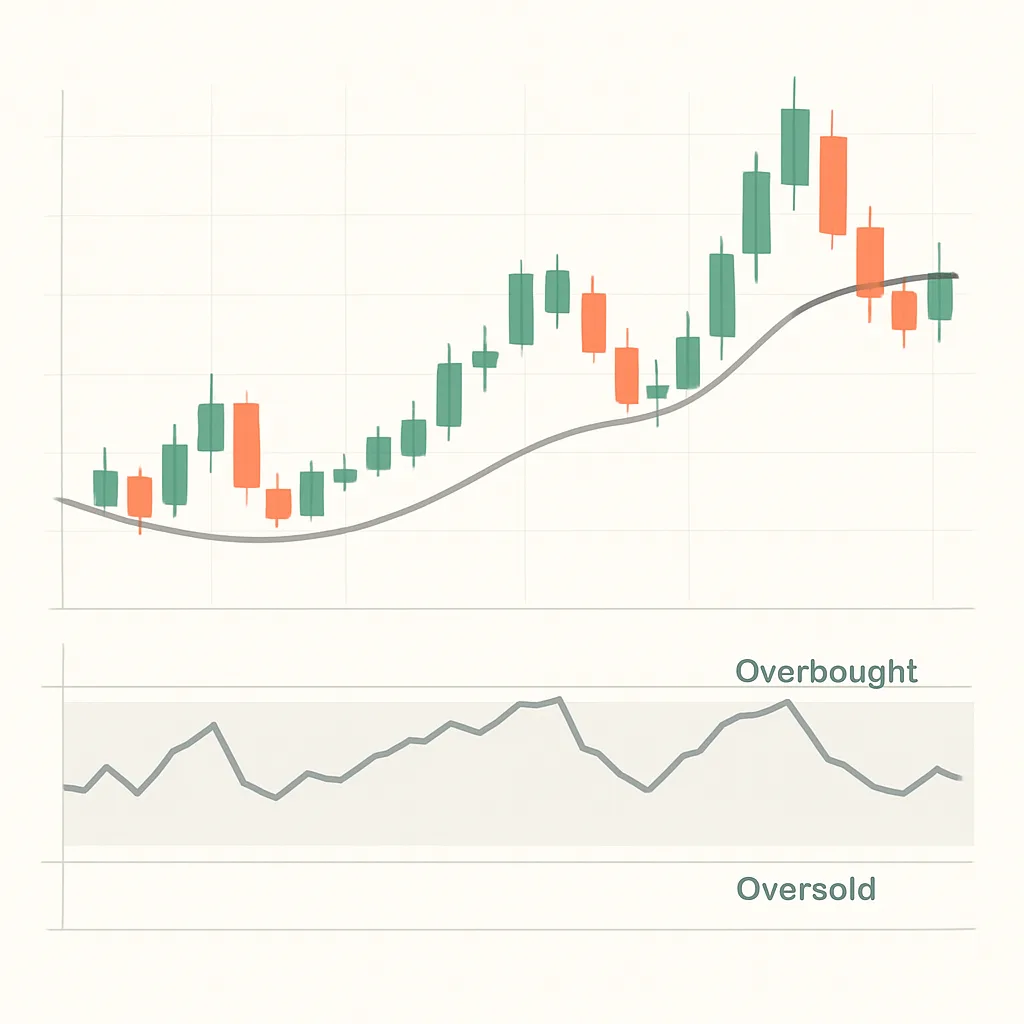
RSI and Moving Averages: Two Chart Indicators Explained
Learn what RSI and moving averages measure, how traders read them, and why neither indicator predicts prices on its own.
Chart indicators transform price data into visual summaries that can help traders examine momentum and trends. The Relative Strength Index (RSI) and moving averages are two widely used tools. They can add context to a chart, but they do not predict future prices or guarantee profitable trades.
What is RSI?
The Relative Strength Index, or RSI, is a momentum indicator that compares recent upward and downward price changes over a selected period. It is usually displayed as a line on a scale from 0 to 100. A common setting calculates RSI over 14 periods, though traders may choose different settings.
RSI readings above 70 are often described as “overbought,” while readings below 30 are often called “oversold.” These labels indicate that price movement has been strong in one direction relative to the selected period. They do not mean a reversal must happen: in a strong uptrend, RSI may remain high, and in a sustained downtrend, it may remain low.
What are moving averages?
A moving average smooths price data across a chosen number of periods. A simple moving average (SMA) gives each period equal weight. An exponential moving average (EMA) gives more weight to recent prices, so it tends to respond more quickly to new movement. Both are often drawn directly over the price chart.
Shorter moving averages react faster but can be more sensitive to everyday price swings. Longer moving averages move more slowly and can help show a broader trend, while responding later to changes. The right period depends on the chart timeframe and the question being examined; there is no universally best setting.
How traders use them together
Moving averages can provide trend context, while RSI can show the strength of recent momentum. For example, a trader might examine whether price is above or below a chosen moving average, then use RSI to assess whether recent buying or selling has been unusually strong. Some traders also watch for a shorter moving average crossing a longer one, or for RSI crossing a threshold.
These events are observations, not instructions. Indicators can give conflicting signals, and a crossover or threshold reading may appear after much of a price move has already happened. Consider the broader chart, trading volume, market conditions, and your risk limits rather than relying on one indicator.
Common limitations and practical use
- Indicators lag: Moving averages are based on past prices, and RSI also summarizes past movement.
- Signals can persist: High or low RSI does not automatically mean price will reverse.
- Settings matter: Changing the timeframe or calculation period can change what a reading shows.
- Markets differ: An approach that seems useful in one asset or market condition may not work in another.
To get familiar with these tools, add RSI and one moving average to a chart and observe how their readings change across different timeframes. Test interpretations with historical examples or paper trading before risking funds. Treat indicators as aids to analysis—not substitutes for a plan, independent research, or careful risk management.