
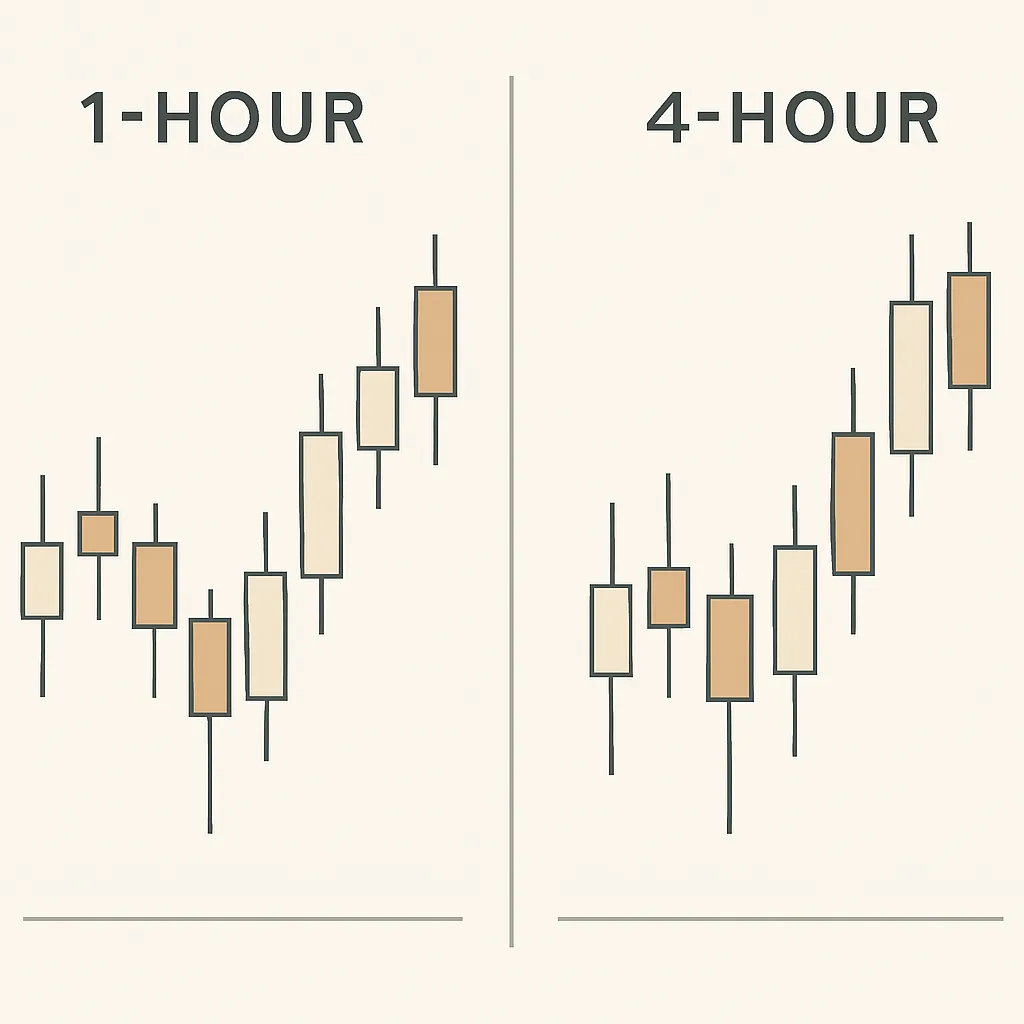
Reading candlestick patterns on the 1h and 4h chart — Oct 2026 #2
Learn what candle bodies, wicks, and common patterns can reveal on 1-hour and 4-hour crypto charts—and how to use them without treating signals as guarantees.
Candlesticks summarize price movement over a chosen period. On a 1-hour chart, each candle records one hour of trading; on a 4-hour chart, each candle records four hours. Reading both can help you see short-term price action in the context of a broader move, but no candle pattern predicts what price must do next.
Read the parts of a candle
Each candle shows the open, high, low, and close for its time period. The thick section, called the body, spans the open and close. A candle that closes above its open is commonly shown as bullish, while one that closes below its open is commonly shown as bearish. The thin lines above and below the body are wicks, or shadows, and mark the period’s highest and lowest prices.
A long body suggests price moved substantially between the open and close. A long wick can show that price reached a level but then moved away before the candle closed. Neither feature gives a complete explanation on its own: consider where the candle formed, the surrounding candles, trading volume if available, and the broader trend.
Patterns to recognize
- Doji: The open and close are close together, leaving a small body. It can reflect hesitation, but it is not automatically a reversal signal.
- Hammer-like candle: A relatively small body sits near the top of a candle with a longer lower wick. After a decline, it may indicate that lower prices were rejected; context and confirmation matter.
- Shooting-star-like candle: A relatively small body sits near the bottom with a longer upper wick. After a rise, it may indicate rejection of higher prices, but does not confirm a reversal by itself.
- Engulfing pattern: A candle’s body covers the preceding candle’s body. Traders may read a bullish or bearish engulfing candle as a shift in near-term momentum, depending on its direction and location.
Compare the 1-hour and 4-hour views
The 1-hour chart shows more detail and more frequent fluctuations. It can help you inspect recent swings, but it may also produce more noise and false signals. The 4-hour chart compresses several hours into each candle, making it easier to assess broader short-term structure while hiding some intraperiod movement.
Start with the 4-hour chart to identify the general context: is price making higher highs and higher lows, lower highs and lower lows, or moving sideways? Then check the 1-hour chart for candles forming near a meaningful area, such as a prior swing high or low. A pattern that aligns with the broader context may be more informative than the same pattern appearing in the middle of an unstructured range, but it still remains uncertain.
Wait for the candle to close
An unfinished candle can change shape before its timeframe ends. A long wick or apparent engulfing pattern may disappear by the close. If you use candle patterns in a plan, decide whether you require a completed candle and what would invalidate your interpretation before acting. Avoid making a decision based only on a candle that is still forming.
Use patterns as evidence, not instructions
Candlesticks describe past price action; they do not guarantee future direction. Combine them with market structure and other relevant information, and define your risk before placing a trade. For example, note the price level that would disprove your setup and size any position so a possible loss fits your risk limits. Keep in mind that crypto markets can move quickly, and stop orders may execute at a different price during sharp moves or low liquidity.
A useful routine is to identify the 4-hour context, examine the 1-hour candle only at a relevant price area, wait for the candle to close, and record what happened afterward. Reviewing examples over time can help you learn which patterns are meaningful in your chosen market and which are simply visual coincidences.