
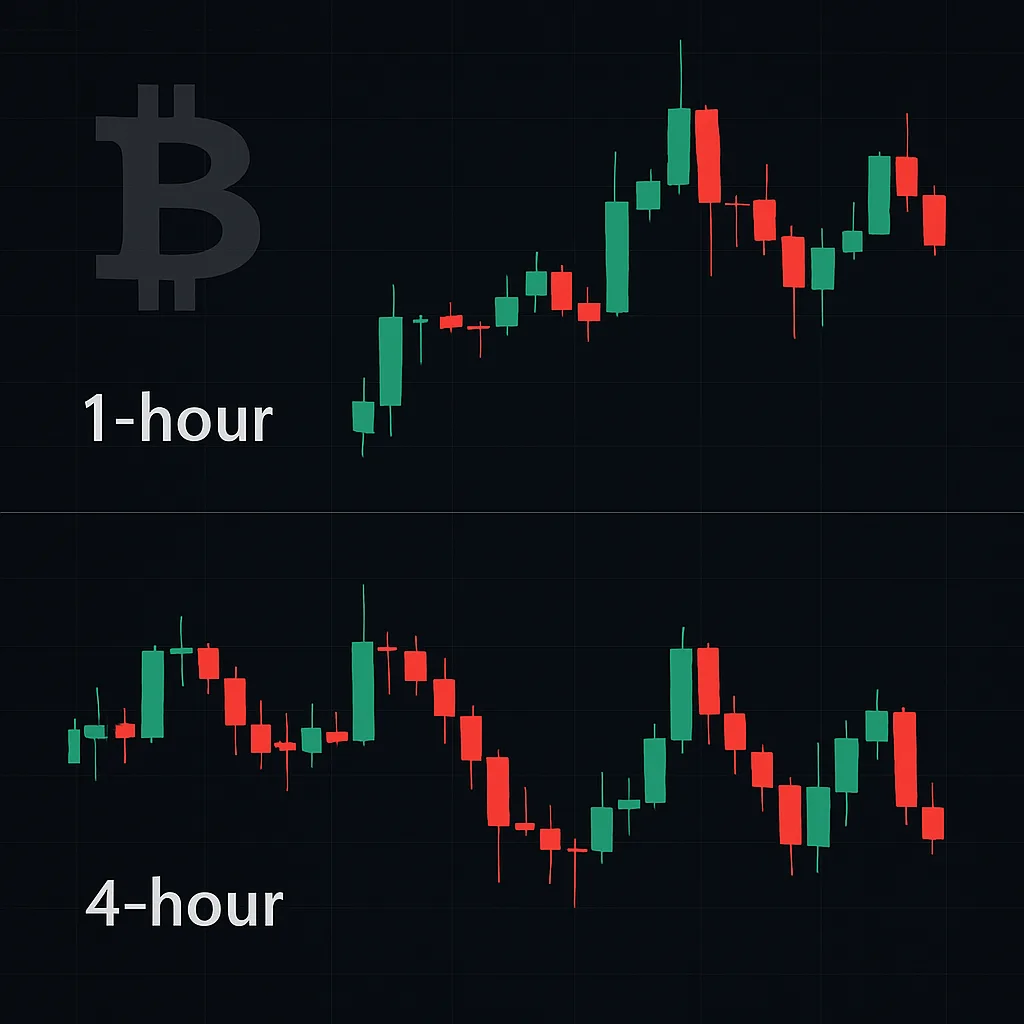
Identifying Key Crypto Trends with 1H and 4H Candlestick Patterns
Learn to identify crucial market trends by reading 1-hour and 4-hour candlestick patterns in crypto trading.
Candlestick patterns are a valuable tool for traders, offering insights into market sentiment and potential price movements. By focusing on 1-hour (1H) and 4-hour (4H) charts, traders can detect significant trends and make more informed trading decisions. This lesson will guide you through the basics of analyzing candlestick patterns on these timeframes.
Understanding Candlestick Basics
Each candlestick on a chart represents a fixed period of time. In the context of 1H and 4H charts, they reflect one hour and four hours of trading activity, respectively. Each candlestick shows the open, high, low, and close prices for its time period. The body of the candle represents the price range between the open and close, while the wicks show the highest and lowest traded prices.
Key Patterns to Recognize
Some key patterns to watch out for include:
- Doji: A doji candlestick has a very small body, indicating indecision in the market. When found on the 1H and 4H charts, it can signal potential reversals.
- Hammer and Hanging Man: Both patterns have small bodies with long lower wicks. Hammers suggest potential bullish reversals, while hanging men indicate possible bearish trends.
- Engulfing Patterns: Bullish or bearish engulfing patterns occur when a larger candlestick body completely engulfs the previous candle, suggesting strong trend continuation.
Analyzing the Context
When analyzing candlestick patterns, consider the context within which they appear. A doji appearing after a strong uptrend may indicate a reversal, while the same pattern in a sideways market might not hold significant meaning. Use other technical indicators like moving averages or RSI alongside candlestick analysis to bolster trading decisions.
Practical Application
To apply this knowledge, consistently monitor 1H and 4H candlestick charts for patterns. Document your observations and backtest your findings to improve your pattern recognition skills over time. Remember, no single pattern guarantees future price movements; always combine with other analysis tools for better accuracy.