
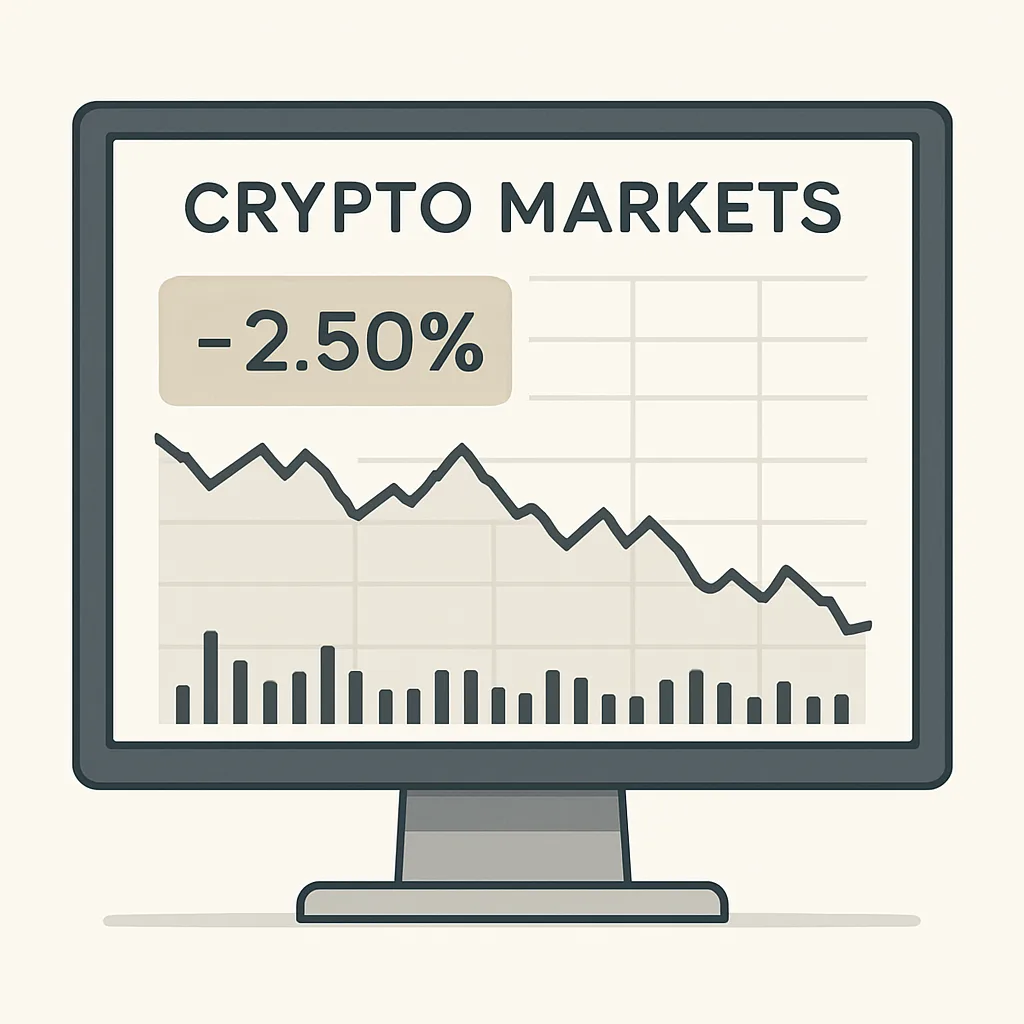
How to Interpret Trading Volume Alongside a Market’s 24-Hour Move
Learn what market-screen volume and 24-hour change show, what they leave out, and how to read them together without treating either as a prediction.
A crypto market screen often puts two figures beside an asset’s price: trading volume and 24-hour change. They answer different questions. The change shows how far the displayed price has moved over a rolling time window; volume estimates how much of the asset or its quoted value has traded during that window. Read together, they offer context—not a forecast or a guarantee of liquidity.
What 24-hour change measures
The 24-hour change is the percentage difference between the current price and the price at the start of the preceding 24 hours. If a coin is quoted at $102 now and was $100 at that point, its change is about +2%. A negative percentage means the current price is below its reference price.
Because this is usually a rolling window, the comparison point moves continuously. It is not necessarily the same as the change since midnight, the opening price of a candle, or your personal return. Your result also depends on your entry price, fees, and any other costs.
What volume measures—and check the unit
Volume records trading activity within a stated period, often the same 24 hours shown on a market screen. Platforms may display volume in the base asset, such as BTC, or as an estimated value in a quote currency, such as USDT. Some screens show a market’s volume for one trading pair; others show an asset’s combined activity across markets. Check the label and scope before comparing figures.
Volume is not the number of unique traders, the amount of money invested, or the amount you can sell instantly without affecting price. Reported volume can also differ between exchanges because each has its own order books, trading pairs, and data sources.
Read the two figures together
- Price up, volume elevated: More trading took place during the move. This describes greater activity, but does not prove the rise will continue.
- Price up, volume subdued: The move occurred with less reported activity. That alone does not establish that the move is weak or likely to reverse.
- Price down, volume elevated: Selling activity coincided with the decline. The figures do not identify who traded or what happens next.
- Price nearly unchanged, volume elevated: Considerable trading occurred while the displayed price ended near its reference level. Buyers and sellers may have exchanged actively without a large net move.
These are descriptions, not standalone trading signals. Volume can rise during volatility in either direction, and a percentage change hides the path price took to reach its current level.
Use a careful comparison
- Confirm the pair and price source. BTC/USDT and BTC/USD can show different prices and activity.
- Read the time period and units. Compare like with like: the same interval, asset or pair, and volume denomination.
- Check the market’s scale. A volume figure that looks large in isolation may be ordinary for a highly traded asset and unusual for a smaller one.
- Look beyond the summary row. Review a price chart, recent trades, and the order book if you need more context. Each has limitations, and displayed orders can change or disappear.
- Consider execution costs separately. A high 24-hour volume does not guarantee a tight spread or enough depth for your order size on your chosen exchange.
Common misreadings
Do not treat a positive 24-hour change as a forecast, or assume high volume means the price must rise. Do not compare volume numbers without checking whether one is in coins and another in quote currency. And do not confuse a market-wide volume figure with the liquidity available in a specific trading pair at the price you want.
For example, a coin can show a positive 24-hour change while falling sharply in the last hour. The headline percentage summarizes the whole rolling window, not every shorter-term move. Checking the chart’s time scale helps reveal that distinction.
Key takeaway
Use 24-hour change to understand the current price relative to its rolling-day reference, and volume to gauge how much trading was reported over the stated period. Confirm units, pair, and time window, then use other market information for context. Neither number predicts future prices or guarantees that a trade can be executed at a particular price.