
How to Read 24-Hour Change and Volume on Crypto Markets
Learn what a market screen’s 24-hour change and volume reveal, how to interpret them together, and why neither metric predicts what happens next.
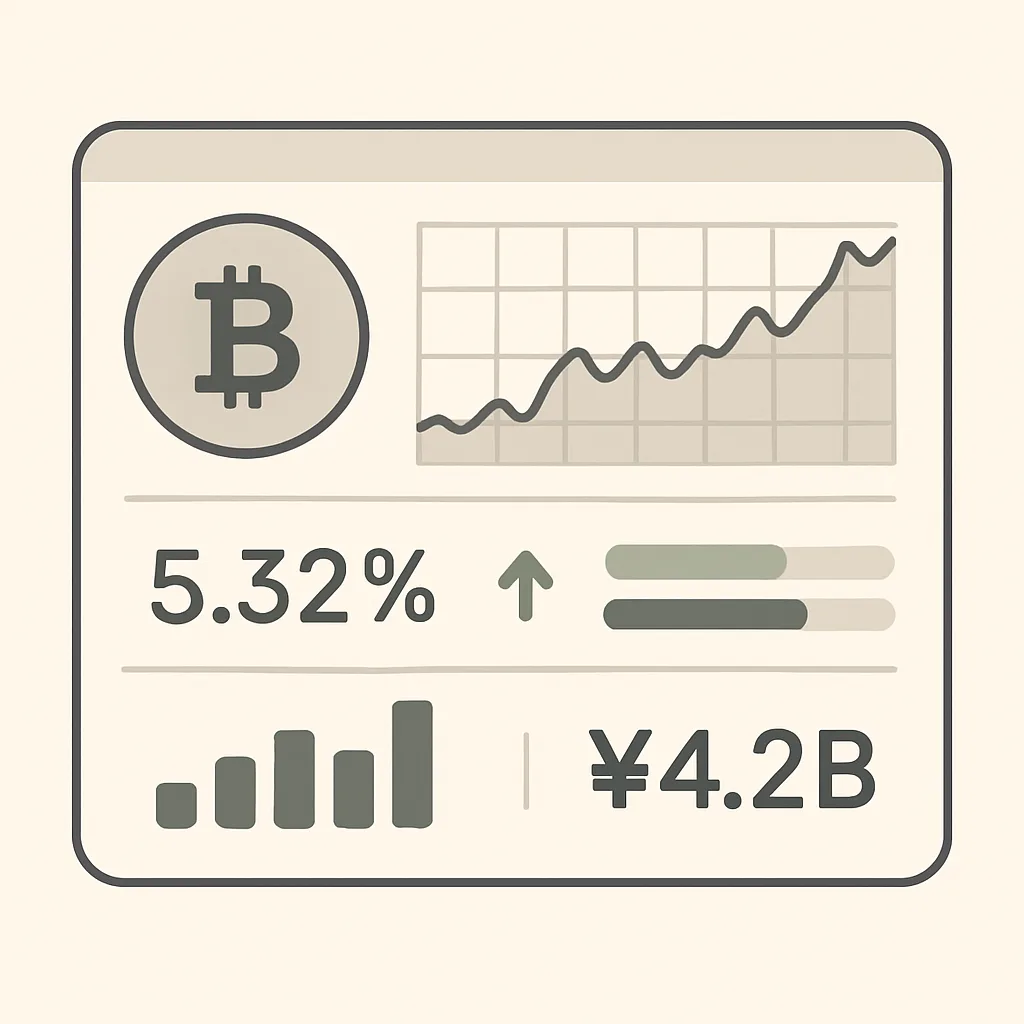
A crypto markets screen often places two figures beside each asset: 24-hour change and volume. They offer a quick snapshot of recent price movement and trading activity, but they answer different questions. Reading them together can add context; treating either as a forecast can be misleading.
What does 24-hour change mean?
24-hour change shows how much an asset’s price has risen or fallen compared with its price 24 hours earlier. It is usually displayed as a percentage. For example, if a coin moves from $100 to $105 over the comparison period, its change is about +5%. A move from $100 to $95 is about -5%.
Many platforms use a rolling 24-hour window, which updates continuously. This is different from a calendar-day change that resets at a set time. Check the platform’s definition if you are comparing figures across exchanges.
The percentage describes a change over that specific window, not the asset’s performance since you bought it, its all-time return, or a guarantee of future direction. A positive reading does not mean the price rose steadily: it may have fallen sharply and then recovered.
What does volume measure?
Volume is the amount of an asset traded during a stated period. Depending on the screen, it may be shown as the number of coins traded or as their total value in a quote currency such as USDT. Confirm the unit and time period before comparing volume figures.
Volume is not the same as the number of trades, unique traders, or money flowing into an asset. Each completed trade has both a buyer and a seller. Volume records the trading activity, while price shows the latest market valuation at the time of the display.
Read the two figures together
- Positive change with higher volume: The price rose while more trading took place than usual. This can indicate increased participation, but it does not establish why the price moved or whether the move will continue.
- Positive change with low volume: The price is up, but activity may be limited. In a thin market, relatively small orders can move the quoted price more noticeably.
- Negative change with higher volume: The price fell during a busier period. This signals active trading alongside the decline, not proof that selling will continue.
- Negative change with low volume: The decline occurred during quieter trading. Check liquidity and spreads before assuming the displayed price is easy to trade at.
These combinations are observations, not trading signals. A 24-hour summary also hides the path taken within the period. A chart can show whether a move was gradual, volatile, or concentrated in a short burst.
Check context before drawing conclusions
Compare volume with the asset’s own typical activity, rather than judging a coin solely against a much larger one. Look at the timeframe, exchange, and quoted currency: volume can differ across platforms, and a screen may show activity from only one venue. If available, review recent chart activity and the order book as additional context.
Also consider liquidity. High reported volume does not guarantee that every order can be filled at the displayed price, especially during fast markets. Low volume can come with wider bid-ask spreads and greater price impact. Check the spread and expected execution price before placing an order.
A simple reading routine
- Confirm whether the change is rolling 24 hours or tied to a calendar day.
- Check the volume unit, period, and exchange coverage.
- Compare activity with the asset’s usual volume on that same market.
- Review a chart to see how the price moved during the period.
- Check liquidity and the spread before making an order decision.
Use 24-hour change to describe recent price performance and volume to describe trading activity over a stated period. Together, they provide useful context for a markets screen, but neither tells you what price will do next.