
Unraveling Key Candlestick Signals on Hourly Charts
Discover how to interpret candlestick patterns on 1-hour and 4-hour charts for effective trading decisions.
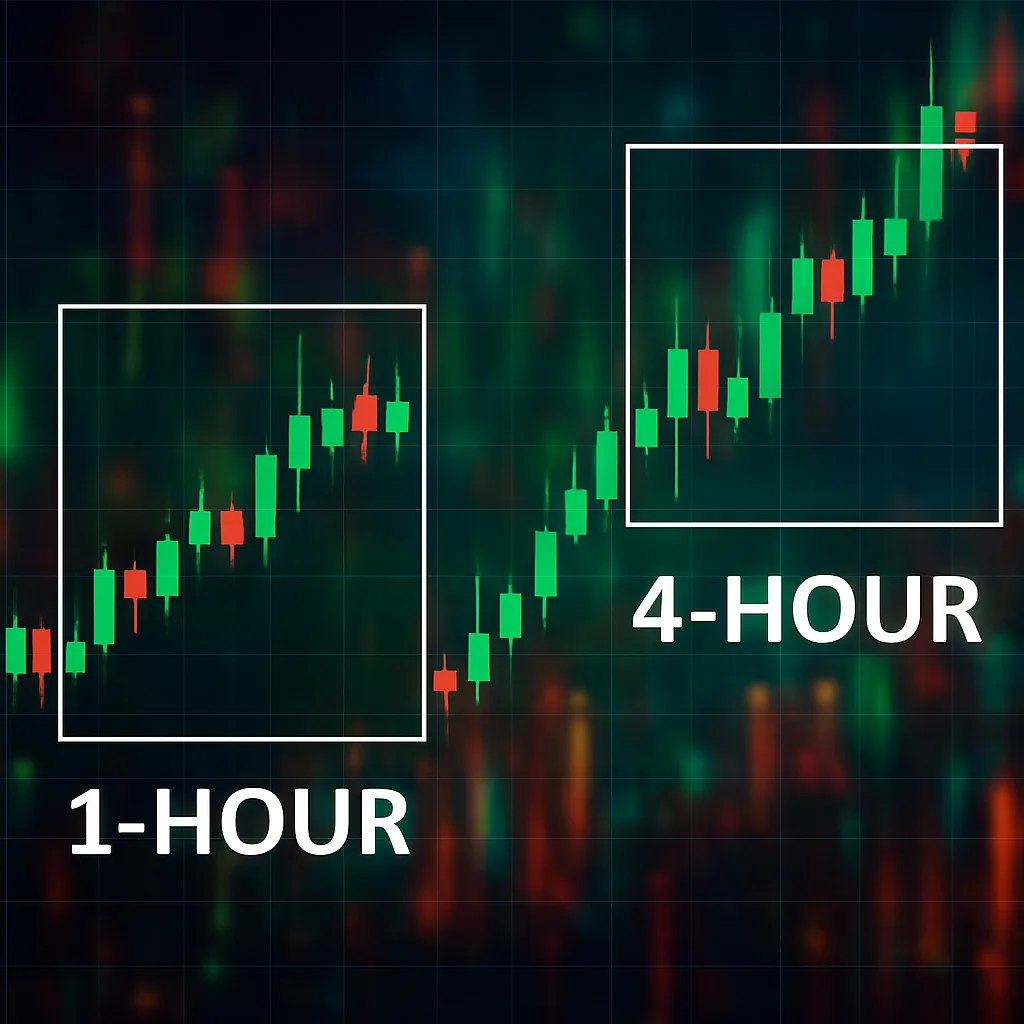
Candlestick charts are a vital tool for traders, providing insights into market sentiment through their formation patterns. This lesson focuses on reading candlestick patterns specifically on 1-hour and 4-hour charts. Understanding these patterns helps traders make informed decisions based on short to medium-term market movements.
Understanding Candlestick Basics
Each candlestick represents the price movement of an asset during a specific time frame, illustrated by a body and wicks (also known as shadows). The body indicates the open-to-close range, while the wicks show the high and low during that period.
Common Patterns on 1-Hour and 4-Hour Charts
- Doji: A doji is formed when the opening and closing prices are almost equal, signaling market indecision and a possible reversal.
- Engulfing Patterns: These occur when a larger candle completely engulfs the previous candle, indicating a strong shift in market sentiment, either bullish or bearish.
- Hammer and Hanging Man: Both patterns have a small body and a long lower wick. A hammer is bullish and appears at the bottom of a downtrend, while a hanging man is bearish and appears at the top of an uptrend.
- Shooting Star and Inverted Hammer: These patterns have a small body and a long upper wick, signaling a potential reversal. A shooting star appears at the top of an uptrend (bearish), whereas an inverted hammer is at the bottom of a downtrend (bullish).
Application and Strategy
When analyzing these patterns on 1-hour and 4-hour charts, traders should consider the overall trend and volume to validate the signals. Combining candlestick analysis with other technical indicators, such as moving averages or RSI, can enhance decision-making.
Conclusion
Mastering candlestick patterns on shorter timeframes like the 1-hour and 4-hour charts can significantly improve your trading strategy by letting you anticipate market moves and adjust your positions accordingly. Practice identifying these patterns on demo accounts to build confidence and accuracy in real-time trading.